Quality
Green tests are only the start
Thousands of unit tests, mutation tests that check whether the tests catch bugs at all, a visual smoke run in a clean browser and a pixel comparison with the baseline. And the owner still plays it before anything merges.
5.1 Gates before a merge

Each gate answers a different question. Unit tests: does the code do what it claims. Mutations: would the tests even notice if it didn’t. Clean export: does what works in the working directory also work from the repository alone. Smoke: does the game start and look right. Performance: does it fit the budget. Playtest: is it any good.
5.2 Mutation tests
The reviewer breaks the code on purpose – flips a condition, changes a constant, brings back an old bug – and checks whether any test notices. A mutant that survives means a hole in the tests, even when every test is green.
After TRAM-1 the old, wrong winding of the D5 corridor joined the mutation set. The ordinary-match test catches it immediately – the same bug won’t quietly come back.
Versioning is checked separately: a change to a generator rule must change the version, and a change to an input that doesn’t affect output must leave it alone – 15 of 15 trials behaved as expected.
| Mutation | Result |
|---|---|
| Old D5 winding restored | caught |
| Left/right door sides swapped | caught |
| Damage from a standing tram | caught |
| No “once per pass” limit | caught |
| Shortest routes instead of longest | caught |
5.3 Visual smoke and the pixel criterion
The smoke run starts the production build from a clean export of the repository in headless Chrome, with a local Worker and no network access beyond the machine. Every console error and every 404 response is a failure. Known environment issues are listed in the report, not masked.
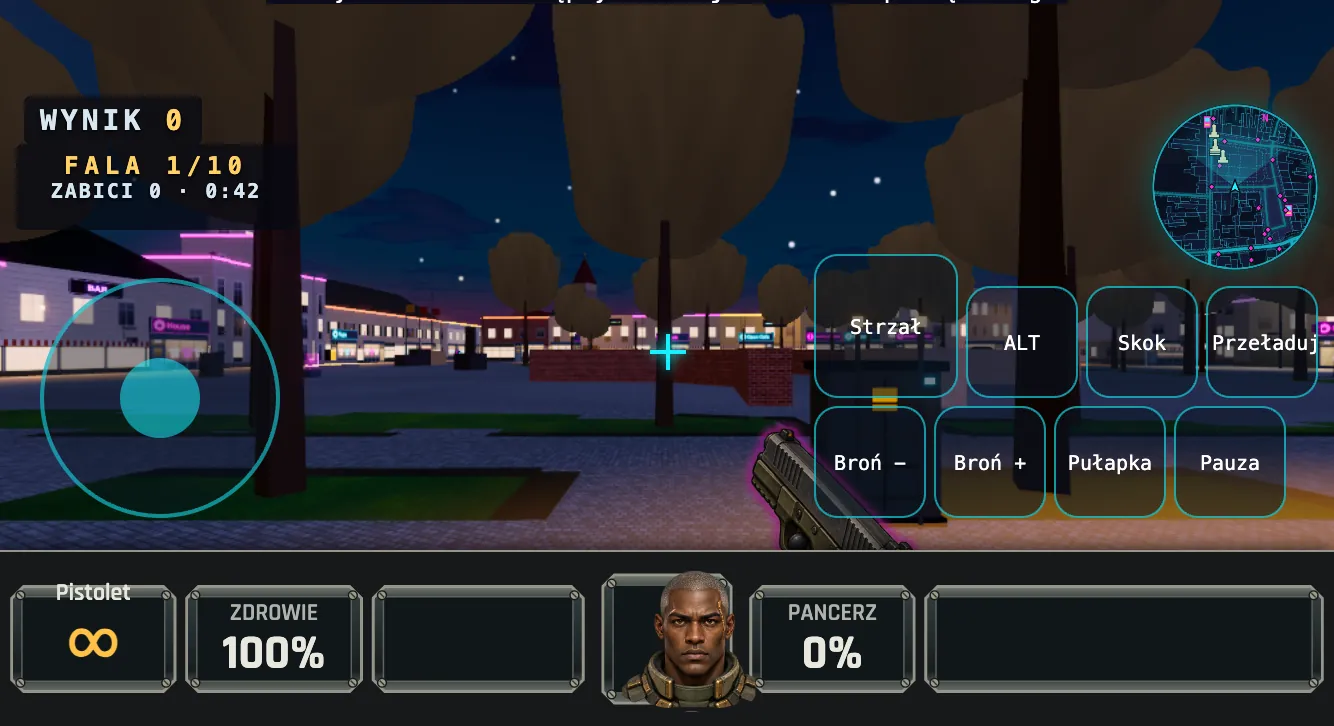
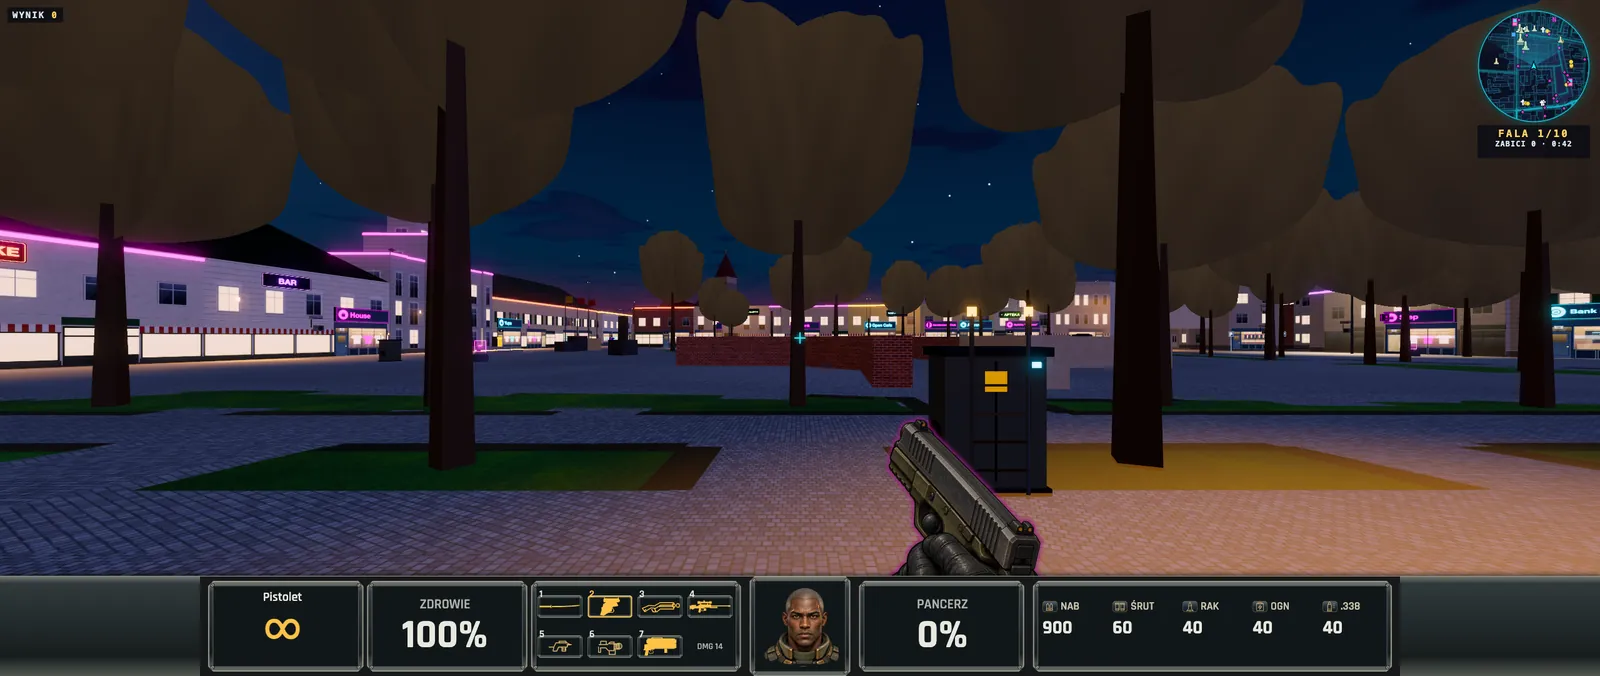
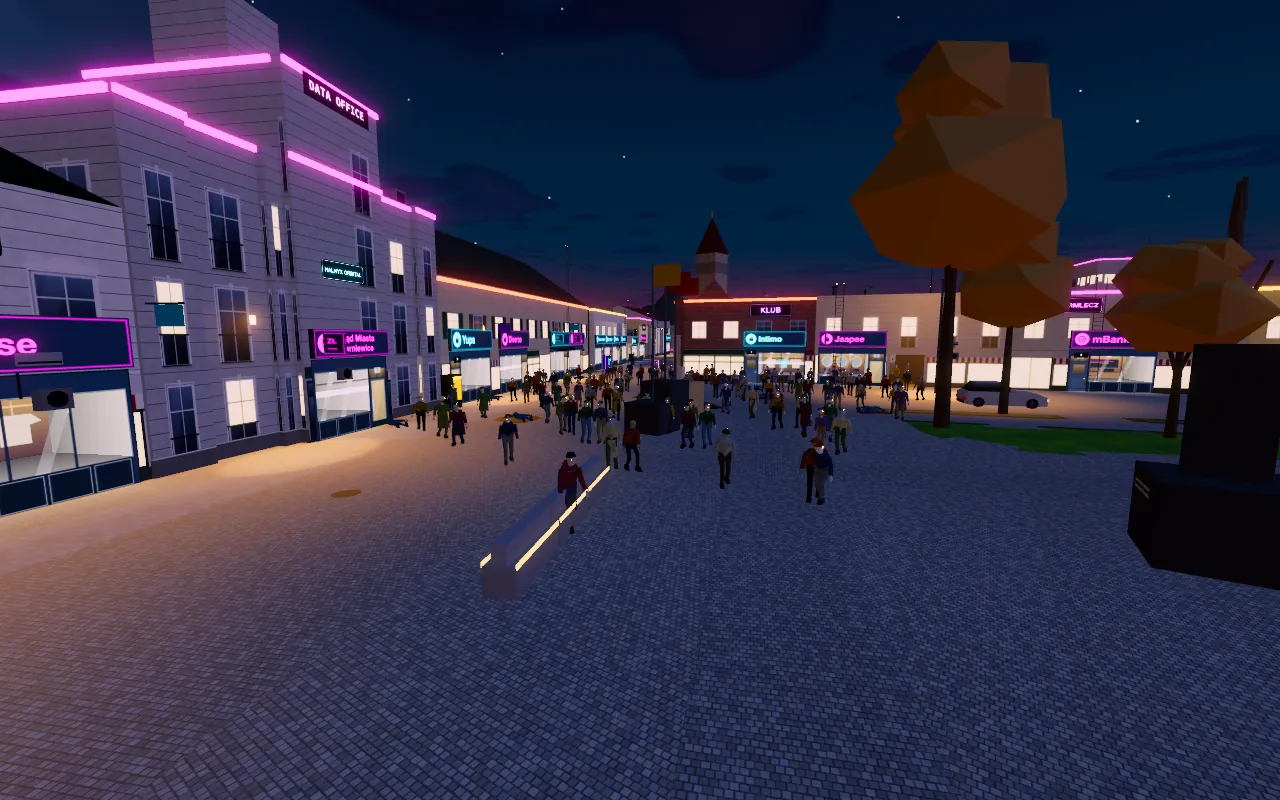
Screenshots are taken across a matrix of windows – from a 667×375 phone to a 2560×1080 monitor, by day and at night, at High and Low quality. When a change must not touch the existing mode, a hard criterion applies: 0.000 % of pixels differing by more than 8/255 from the baseline.
5.4 Performance gates
| Measurement | Result | Threshold |
|---|---|---|
| Simulation tick, p95 (PLAY-1 scenario) | 1.344 ms | 3 ms |
| Enemy field, p95 | 0.744 ms | 1.5 ms |
| Łódź r600, 3 moving trams, 60+ bots, p95 | 1.047 ms | 3 ms |
| LocalServer: 169.0 → 40.9 ms | 4.13× | ≥ 3× |
Measurements have conditions: mains power, a quiet window and CPU load below a threshold. When a condition isn’t met, the measurement is skipped and documented in the report – failed measurements are never replaced with zeros or older results.
5.5 The work in numbers
- 869commits in 15 iterations (client + backend)
- 179task reports in the repositories
- 1634 + 937backend and client tests, 0 failures
- 4.13×LocalServer speed-up (threshold: 3×)
Show the data as a table
| Iteration | client | backend | total |
|---|---|---|---|
| iteration 1 | 15 | 12 | 27 |
| iteration 2 | 21 | 14 | 35 |
| iteration 3 | 23 | 25 | 48 |
| iteration 4 | 13 | 10 | 23 |
| iteration 5 | 12 | 10 | 22 |
| iteration 6 | 12 | 4 | 16 |
| iteration 7 | 47 | 6 | 53 |
| iteration 8 | 40 | 7 | 47 |
| iteration 9 | 107 | 29 | 136 |
| iteration 10 | 48 | 43 | 91 |
| iteration 11 | 45 | 41 | 86 |
| iteration 12 | 18 | 23 | 41 |
| iteration 13 | 39 | 30 | 69 |
| iteration 14 | 57 | 9 | 66 |
| iteration 15 | 86 | 23 | 109 |
| Σ | 583 | 286 | 869 |
Numbers aggregated from git history (all branches) and task reports; no branch names or commit contents.